Figure 1: DNS monitoring overview
Figure 1: DNS monitoring overview
named.conf to enable logging of statistics:
options {
        statistics-interval 1;
};

logging {
        channel stat_file {
                file "/var/log/named/stats.log" versions 3 size 1k;
        };
        category statistics {
                stat_file;
        };
};
Look in /var/log/named to check if a file named
stats.log appears. Every minute it should log three lines,
starting with USAGE, NSTATS and XSTATS. Named takes care of rotating
the log file itself, so you do not have to worry about the disk
filling up.
getdnsstats to the
location of your Perl executable. Copy the script to
/usr/local/bin.
Test the script by running it. If all goes well the script returns 41 lines,
each containing one number.
snmpd.conf file:
exec .1.3.6.1.4.1.4502.1.4 dnsstats /usr/local/bin/getdnsstats
snmpwalk -v 1 localhost public .1.3.6.1.4.1.4502.1.4
You should see the statistics appear in the output of snmpwalk:
enterprises.4502.1.4.1.1 = 1
enterprises.4502.1.4.2.1 = "dnsstats"
enterprises.4502.1.4.3.1 = "/usr/local/bin/getdnsstats"
enterprises.4502.1.4.100.1 = 0
enterprises.4502.1.4.101.1 = "21068700."
enterprises.4502.1.4.101.2 = "8506900."
.
.
.
enterprises.4502.1.4.101.40 = "3571156."
enterprises.4502.1.4.101.41 = "10521912."
enterprises.4502.1.4.102.1 = 0
Defaults and Targets file to your
Cricket configuration directory
and change the names in the Targets file to point to your DNS servers.
Now wait until Cricket has gathered enough samples to show a decent graph.
Figure 2 shows an example graph of one of our internal DNS server, plotting
the most common lookup types.
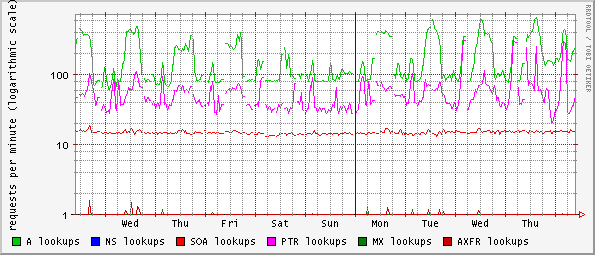
Figure 2: Sample DNS graph